
From Dusty Laptop to Production Kubernetes
19 stages. 63 lessons. 11 debugging commits for SSO alone. One Dell laptop that refused to be e-waste.
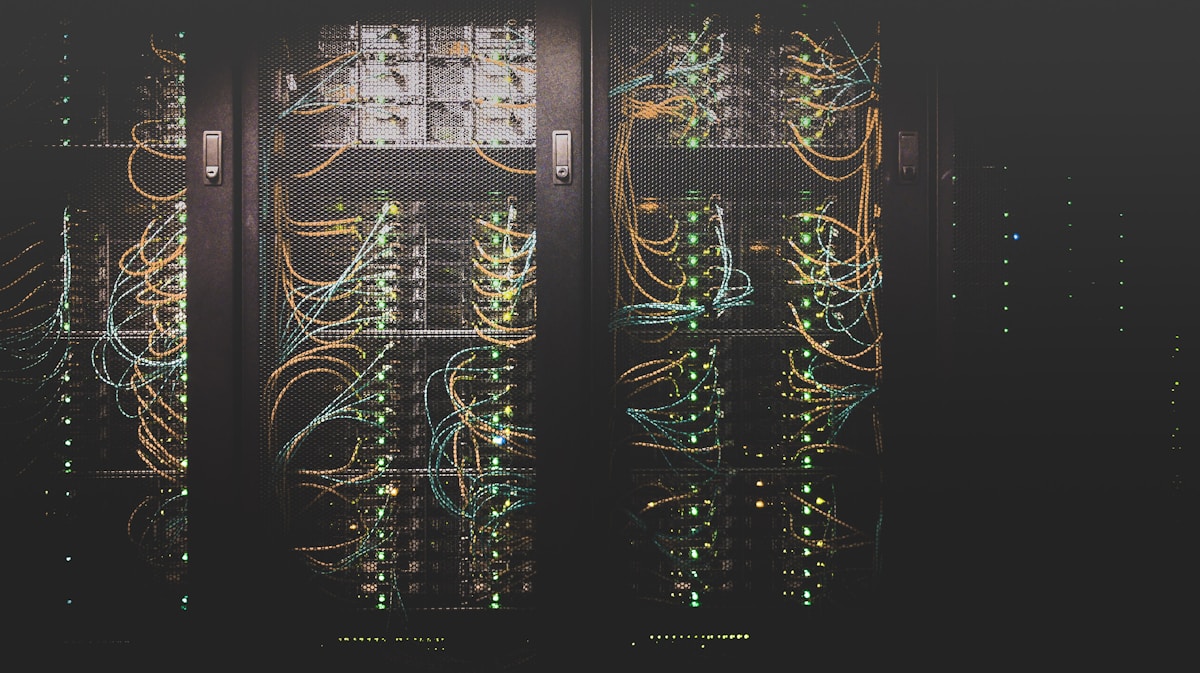
19 stages. 63 lessons. 11 debugging commits for SSO alone. One Dell laptop that refused to be e-waste.
The Pitch
I had a Dell laptop collecting dust in a closet. It had 16 GB of RAM, a 512 GB NVMe drive, and the kind of keyboard where three keys were permanently shiny from overuse. Most people would have recycled it. I turned it into a production-grade Kubernetes cluster.
This post is the story of that build: every decision, every debugging session, and every lesson learned along the way. It is not a tutorial. It is the real, unedited log of what happens when a systems engineer decides to build infrastructure the hard way: with an immutable OS that has no SSH, a GitOps pipeline that enforces every change through Git, and a single-node cluster that still manages to run SSO, monitoring, public-facing services, and automated certificate management.
If you have ever considered building a homelab and wondered whether it is worth the effort, this post is for you.
Why Talos Linux (and Why No SSH Matters)
Most homelab guides start with Ubuntu Server or Proxmox. I chose Talos Linux, which is a different animal entirely. Talos is an immutable, API-driven operating system built specifically for Kubernetes. There is no SSH. There is no shell. There is no package manager. You communicate with the OS exclusively through an API client called talosctl.
That sounds restrictive, and it is. But that restriction is the point. When you cannot SSH into a box and manually fix things, you are forced to do everything declaratively. Every configuration change goes through the API. Every Kubernetes manifest lives in Git. There is no drift, because there is no way to create drift.
The tradeoff hit me on day one: I had set up Talos five weeks earlier, and my talosconfig file had silently corrupted to 25 bytes. Without that file, the machine was a brick. No SSH fallback. No recovery console. Just a laptop running an OS I could not talk to.
Lesson #1 (The Hard Way): Back up your talosconfig. It is the only key to the machine. Lose it and you are reimaging from scratch. Store it in Bitwarden, not just on your Mac.
I got lucky: the original config was still sitting in my Git repo from the initial setup. I copied it back, verified connectivity, and made a mental note to never let that happen again.
The Stack
Here is every layer of the cluster, from hardware to application:
| Layer | Tool | Why |
|---|---|---|
| Hardware | Dell laptop | 15.6 GB RAM, 512 GB NVMe, repurposed |
| OS | Talos Linux v1.12.1 | Immutable, API-only, zero drift |
| Orchestration | Kubernetes v1.35.0 | Single control-plane node |
| CNI | Cilium v1.18.5 | Replaced Flannel + kube-proxy + MetalLB |
| Ingress | Traefik v3.6.8 | Host-based routing, middleware chains |
| Storage | Longhorn | Replicated block storage over iSCSI |
| Certificates | cert-manager + LE | DNS-01 via Cloudflare, auto-renewal |
| GitOps | Flux v2.7.5 | Git is the single source of truth |
| Monitoring | Prometheus + Grafana | kube-prometheus-stack, Alertmanager |
| Auth | Authentik SSO | ForwardAuth via Traefik middleware |
| Public access | Cloudflare Tunnel | Zero open router ports |
Every component was chosen for a reason. Let me walk through the most interesting decisions.
The Cilium Migration (or: Why I Replaced Three Tools with One)
The cluster originally ran Flannel for networking, kube-proxy for service routing, and MetalLB for giving services real LAN IPs. That is three separate components, three sets of configuration, and three things that can break independently.
MetalLB broke first. Its FRR (Free Range Routing) speaker pods would not start on Talos because the PodSecurity admission controller blocked the required Linux capabilities. I spent an hour patching namespace labels, adjusting securityContexts, and reading Talos GitHub issues before stepping back and asking: why am I maintaining three networking tools?
Cilium replaced all three. One Helm chart. One set of values. It handles CNI, replaces kube-proxy with eBPF, and provides L2 load balancing with a simple IP pool configuration. The migration took 30 minutes and deleted more YAML than it added.
Lesson #6: If you are running Talos, just use Cilium from the start. MetalLB plus PodSecurity plus FRR on an immutable OS is a debugging trifecta you do not want.
The VLAN Incident
Before deploying services, I decided to move the Dell onto a dedicated Servers VLAN (VLAN 50, 192.168.50.0/24) on my UniFi Dream Machine SE. Clean separation from IoT devices, cameras, and guest traffic. Good network hygiene.
Except I changed the VLAN port assignment before updating the Talos machine config with the new static IP. The node moved to VLAN 50 but was still configured for 192.168.1.196. It dropped off the network instantly. No SSH to fix it. No API access because talosctl was pointed at the old IP.
The fix required connecting a monitor and keyboard directly to the Dell, using the Talos maintenance mode to apply a config patch with the correct IP, and rebooting. Thirty minutes of downtime for a change that should have taken thirty seconds.
Lesson #2 (Critical): Update the machine config BEFORE changing the network. Talos applies the new config on next boot. If the node is already on the new network with the old IP, you have locked yourself out.
GitOps with Flux: The Good and the Painful
Flux watches a GitHub repository and continuously reconciles the cluster state to match what is in Git. Change a Helm value, push to main, and Flux applies it within 10 minutes. No kubectl apply. No manual deployments. Every change is auditable, reversible, and version-controlled.
That is the sales pitch. Here is the reality.
When I tried to bring existing Helm releases under Flux management, every single one failed. Flux expects to own the release lifecycle from the beginning. If you have already installed something with helm install, Flux sees a release it did not create and refuses to touch it. The error message is unhelpful: "has no deployed releases."
The fix is to delete the Helm release secrets from the cluster (not the resources, just the secrets that track the release) and let Flux reinstall from scratch. This works, but it means a brief period where your services are technically unmanaged. For a homelab, that is fine. For production, you would want to plan the migration more carefully.
Flux also required careful ordering. Without dependsOn declarations, it would try to deploy applications before their infrastructure dependencies (Traefik, Longhorn, cert-manager) were ready. Pods would crash-loop waiting for StorageClasses that did not exist yet. Adding explicit dependency chains fixed the ordering, but it took a few rounds of trial and error to get right.
SOPS Encryption: Secrets in Git Without the Guilt
One of the first things I did wrong was commit my talosconfig to GitHub. It contained machine secrets and cluster credentials. I caught it quickly, ran git rm --cached, added the file to .gitignore, and moved on. But it was a reminder that GitOps and secrets do not mix unless you are encrypting.
SOPS (Secrets OPerationS) with age encryption solved this cleanly. Every Kubernetes Secret in the repo is encrypted at rest. Flux has the age private key and decrypts on the fly during reconciliation. The workflow is straightforward: create the secret YAML, encrypt it with sops, commit the encrypted version, and Flux handles the rest.
The key detail that tripped me up: SOPS uses a .sops.yaml file with path_regex rules to determine which files to encrypt. If you create a secret in /tmp/ and then move it into the repo, the path does not match and SOPS refuses to encrypt. Always create secrets at their final path.
Public Access Without Opening a Single Port
The cluster needed to be accessible from the internet for the portfolio site and for remote access to monitoring tools. The traditional approach is port forwarding: open ports 80 and 443 on your router, point them at the cluster, and hope nobody scans you.
Cloudflare Tunnel is better. A small agent (cloudflared) runs inside the cluster and establishes an outbound connection to Cloudflare's edge network. Traffic flows in through Cloudflare, gets filtered, cached, and DDoS-protected, then arrives at the cluster through the existing tunnel. Zero inbound ports open on the router. No dynamic DNS. No hairpin NAT issues.
Combined with cert-manager's DNS-01 challenge via Cloudflare's API, I got automatic Let's Encrypt certificates for all services without exposing port 80 for HTTP-01 validation. The certificates renew automatically, and the whole thing is managed through Git.
Defense-in-Depth: Cloudflare Access at the Edge
Having public services accessible through Cloudflare Tunnel solved the port-forwarding problem. But now I had three services (TT-RSS, Uptime Kuma, Grafana) with their own login pages exposed to the internet. While they're not wildly popular targets, they're still publicly probed within hours of going live.
Cloudflare Access adds an additional defense layer at the edge, before traffic even enters the cluster. It acts as a policy engine that sits in front of your application. Only users who pass the Cloudflare Access policy get routed to your cluster.
I configured it to require an email OTP (one-time password) for access. Anyone trying to visit rss.naviauxlab.com, uptime.naviauxlab.com, or grafana.naviauxlab.com has to enter their email address and solve an OTP challenge before they can even reach the Traefik ingress. This blocks the vast majority of automated scans and credential-stuffing bots before they hit your application-level authentication.
The configuration is straightforward via the Cloudflare API, and it costs nothing for up to 50 users. The policy is evaluated at Cloudflare's edge, milliseconds from the user, so there's no noticeable latency penalty.
This exemplifies defense-in-depth: you don't rely on a single authentication layer. You have:
- Edge authentication (Cloudflare Access): blocks bots and unauthorized users before they reach your infrastructure
- Tunnel encryption (Cloudflare Tunnel + TLS): encrypted channel from cluster to edge
- Cluster authentication (Authentik ForwardAuth): SSO and session management inside the cluster
- Application security (security headers, HSTS, X-Frame-Options): hardening at the response level
- Network policies (Cilium): pod-to-pod isolation at the kernel level
Each layer is independent. Losing one doesn't compromise the others.
The Authentik SSO Marathon
The last major feature was SSO. Three public services (TT-RSS, Uptime Kuma, Grafana) had their login pages exposed to the internet. Anyone could probe for default credentials or exploit CVEs. The fix was Authentik, an open-source identity provider that integrates with Traefik's ForwardAuth middleware.
The concept is simple: when you visit rss.naviauxlab.com, Traefik asks Authentik if you are authenticated. If not, you get redirected to a login page at auth.naviauxlab.com. After logging in, you are sent back to the original URL. One login covers all three services.
The implementation was anything but simple. It took 11 git commits to go from "deploy Authentik" to "working SSO flow." Here is the abbreviated debugging timeline:
- Commit 1: Initial deployment. Used
grep -oP(Perl regex) in the deployment script. Does not exist on macOS. Switched togrep -oE. - Commit 2: SOPS encryption failed because the secret was created in
/tmp/, which did not match.sops.yamlpath rules. - Commit 3: macOS
sed -imangled the kustomization.yaml, merging two YAML list entries onto one line. Rewrote with Python. - Commit 4: HelmRepository created in the wrong directory. Moved to match the per-component pattern.
- Commit 5: Used Deployment-style
secretKeyRefin Helm values. Flux usesvaluesFromwithtargetPathinstead. - Commit 6: Chart deprecated
env/envValueFrom. Migrated toglobal.env. - Commit 7: Bitnami PostgreSQL image tags had been deleted from Docker Hub. Tried overriding with available tags.
- Commit 8: Bitnami subchart mounted paths as read-only, incompatible with official Postgres images. Upgraded entire chart to 2025.x.
- Commit 9: PostgreSQL was running but Authentik could not connect. Missing the second
valuesFromentry forauthentik.postgresql.password. - Commit 10: ForwardAuth wired to services, but duplicate annotations blocks in Grafana's HelmRelease caused all infrastructure reconciliation to fail.
- Commit 11: Forward_domain mode hit a known Authentik bug (mismatched session ID). Switched to forward_single with per-app outpost callback IngressRoutes.
Each of those commits represents a debugging session that ranged from five minutes to two hours. The PostgreSQL password issue (commit 9) was particularly frustrating: the database was running fine, the password was configured, but it was configured at the wrong YAML path. The Helm chart needed the password injected at both postgresql.auth.password (for the database subchart) and authentik.postgresql.password (for the application itself). Missing one silently broke everything.
Lesson #60: Use forward_single mode for Authentik Proxy Providers on Traefik. Forward_domain mode has a known session mismatch bug. Forward_single requires outpost callback IngressRoutes on each app domain, but it actually works.
Observability: Knowing What Is Happening
The monitoring stack is kube-prometheus-stack, which bundles Prometheus, Grafana, Alertmanager, and a set of default recording rules and dashboards. On top of that, Uptime Kuma provides external HTTP monitoring for every service.
Prometheus scrapes metrics from every pod, node, and Kubernetes component. Grafana visualizes them. Alertmanager routes alerts. Uptime Kuma pings each service endpoint every 60 seconds and tracks response times, SSL certificate expiry, and uptime percentages. Between these tools, I know within a minute if anything goes down.
The most useful dashboard turned out to be the Node Exporter view showing memory pressure. On a 16 GB single-node cluster running 20+ pods, memory is the first constraint. Watching the available memory trend over a few days showed exactly how much headroom remained for new services.
Production Readiness Audit
About halfway through the build, I realized I was treating this like a hobby project but wanting production-grade results. So I wrote a formal audit checklist: nine items that a real production cluster would need. Then I worked through them one by one.
| # | Audit Item | Status |
|---|---|---|
| 1 | SOPS secret encryption | Resolved |
| 2 | Resource limits on all pods | Resolved |
| 3 | Pinned container image tags | Resolved |
| 4 | Health probes on all deployments | Resolved |
| 5 | Monitoring stack (Prometheus + Grafana + Alertmanager) | Resolved |
| 6 | Storage snapshots (Longhorn recurring) | Resolved |
| 7 | Network policies (default-deny + explicit allow) | Resolved |
| 8 | SSO / RBAC (Authentik ForwardAuth) | Resolved |
| 9 | Disaster recovery runbook | Resolved |
Nine out of nine resolved. It is still a homelab, but it is a homelab that would pass a basic production readiness review.
Architecture at a Glance
Here is how traffic flows through the system:
Internet → Cloudflare Edge → Cloudflare Tunnel → cloudflared (K8s pod)
  → Traefik Ingress Controller (192.168.50.200)
    → Authentik ForwardAuth check
      → If authenticated: route to service
      → If not: redirect to auth.naviauxlab.com

Git push → GitHub → Flux (polls every 10 min)
  → kustomize-controller → applies manifests
  → helm-controller → manages Helm releases

Pod → PVC → Longhorn CSI → iSCSI → NVMe disk
Everything is declarative. The Git repository is the single source of truth. If the cluster were destroyed tomorrow, I could rebuild it from the repo and a handful of backed-up credentials.
What Is Running
The cluster currently hosts six user-facing services:
- Tiny Tiny RSS: self-hosted RSS reader at rss.naviauxlab.com
- Uptime Kuma: uptime monitoring at uptime.naviauxlab.com
- Portfolio: personal site at steven.naviauxlab.com (public, no auth)
- Grafana: dashboards and metrics at grafana.naviauxlab.com
- Authentik: SSO identity provider at auth.naviauxlab.com
- Prometheus + Alertmanager: internal metrics and alerting
Plus infrastructure services: Traefik, Longhorn, cert-manager, Cilium, Flux, and cloudflared. Total pod count is around 25, using roughly 2 GB of the 16 GB available.
Five Lessons I Wish I Had Known Before Starting
1. Talos has no escape hatch. Every other Linux distribution lets you SSH in and fix things. Talos does not. If your API config is lost, the machine is unreachable. If your network config is wrong, there is no shell to debug from. This forces better practices, but the learning curve is vertical.
2. GitOps migrations are messy. Flux cannot adopt Helm releases it did not create. You will end up deleting release secrets and letting Flux reinstall things. Plan for this. It is easier to start with Flux from day one than to migrate later.
3. One YAML mistake can block everything. A duplicate annotations key in a single HelmRelease caused every infrastructure kustomization to fail. Not just the affected service: everything. Flux's kustomize-controller builds the entire directory tree. One malformed file blocks the whole pipeline.
4. Read the Helm chart source, not the docs. Documentation for Helm charts is often outdated. The values.yaml in the chart repository is the real documentation. When Authentik's docs said to use env/envValueFrom but the chart had migrated to global.env, reading the actual chart source saved hours.
5. Debugging is the actual skill. Building the cluster was not the hard part. Debugging why Cilium crash-looped on Talos (missing capabilities), why PostgreSQL would not initialize on Longhorn (lost+found directory), why Authentik's session IDs mismatched (forward_domain bug): that was where the real learning happened. Each debugging session taught more than any tutorial.
What Comes Next
One item remains on the roadmap:
- Offsite backups: Longhorn snapshots to Backblaze B2 for true 3-2-1 backup. Right now, snapshots are on the same NVMe drive. One hardware failure loses everything.
Renovate is now deployed and running weekends-only, auto-detecting Helm chart and container image updates, and opening PRs for manual or automated review based on update type.
Beyond that, the cluster is a platform. Adding a new service takes five minutes: write the manifests, push to Git, and Flux handles the rest. That is the whole point of building this infrastructure: to make future work trivial.
The Real Value of a Homelab
This project took two days. In that time, I went from a dusty laptop to a fully operational Kubernetes cluster with GitOps, SSO, monitoring, public-facing services, automated TLS, automated dependency updates, and a disaster recovery runbook. Along the way, I documented 63 lessons that will save time on every future infrastructure project.
A homelab is not about the services it runs. It is about the skills it forces you to develop. Every debugging session with Talos taught me something about how Kubernetes actually works beneath the abstractions. Every Flux reconciliation error made me better at reading YAML. Every Authentik commit forced me to understand how reverse proxy authentication flows work at the HTTP level.
The Dell laptop is no longer collecting dust. It is running 25 pods, serving four public domains, and teaching me something new every time I push a commit.